AT A GLANCE
The first benchmark for senescence-conditioned cell morphology generation
SenoFlow combines 87,391 real single-cell DAPI nuclear crops from three public Xenium tissue panels with continuous senescence scores and computationally generated temporal sequences, creating a benchmark for studying how cell morphology changes along senescence progression.
Dataset
Dataset Demo
Real Cell Crops
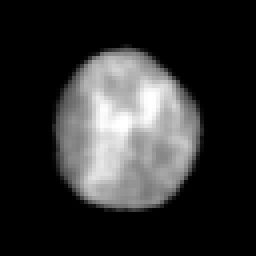
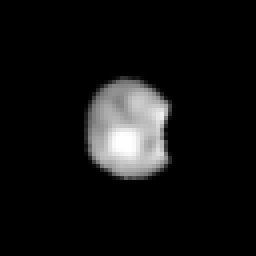
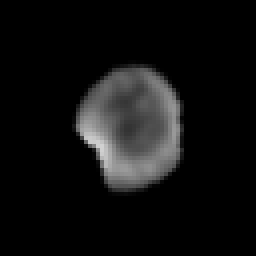
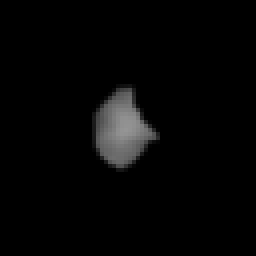
Generated Temporal Sequences
Low senescence score
High senescence score


.jpg)
.jpg)
Method
Method Summary
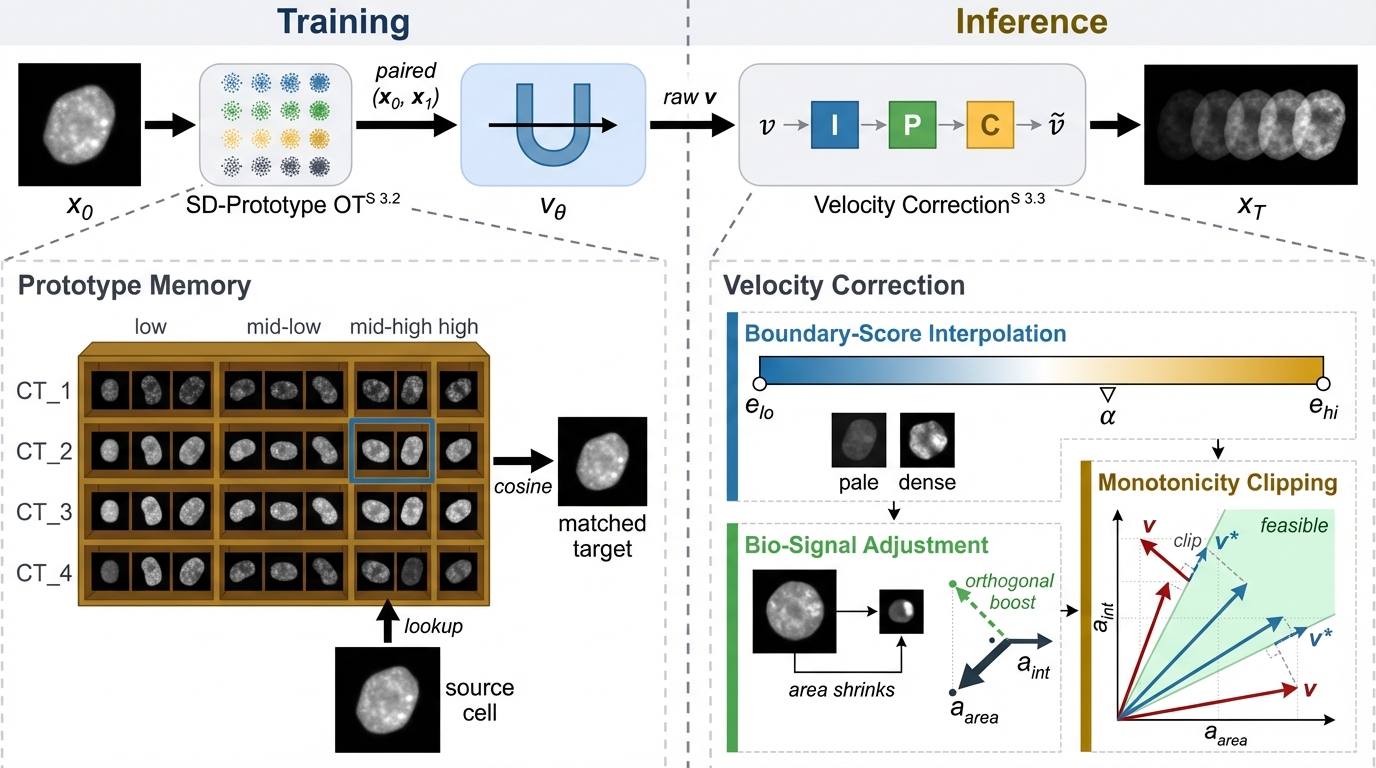
We adopt flow matching as the backbone for senescence-conditioned generation. We propose SD-Prototype OT to stabilize transport under heterogeneous cell types with continuous scores and Continuous-Score Velocity Correction to preserve biologically consistent trajectory progression.
Benchmark Results
Evaluation Protocol and Benchmark Comparison
Evaluation Protocols
Automatic Metrics
- FID: measures realism of generated images via feature distributions.
- KID: complements FID with more reliable estimation under small sample sizes.
- ρ (sig): mean signed Spearman correlation on significant metric across cell types.
- Effect: fraction of real-data morphological shift reproduced by the model.
- Viol: mean monotonicity violation ratio.
Expert Study
Specialists in senescence and cell biology review generated trajectories in a blinded setting. Scores are reported on a 1-5 scale and averaged across experts and evaluated samples.
- Realism: whether generated images resemble real cell nuclei.
- Fidelity: whether progression reflects biologically plausible ageing dynamics.
- preservation: whether original cell identity is maintained.
Benchmark Results
We evaluate 13 baselines and our method under the same per-cell-type protocol, grouped into non-FM generators and Flow Matching variants.
| Method | FID | KID (×103) | ρ (sig) | Effect (%) | Viol (%) | Realism | Fidelity | preservation |
|---|---|---|---|---|---|---|---|---|
| NON-FM GENERATORS | ||||||||
| cVAE | 71.70 | 44.29 | 0.020 | 3.0 | - | - | - | - |
| CCDM | 43.20 | 21.37 | 0.162 | 37.0 | - | - | - | - |
| FLOW MATCHING VARIANTS | ||||||||
| iMF | 14.16 | 3.72 | 0.108 | 40.0 | 0.2 | - | - | - |
| MeanFlow | 17.95 | 6.05 | 0.115 | 80.0 | 39.3 | - | - | - |
| Contrastive FM | 26.24 | 10.83 | 0.307 | 55.7 | 38.5 | - | - | - |
| Noise-start CFM | 36.81 | 17.24 | 0.575 | 75.6 | 33.4 | - | - | - |
| Rectified Flow | 61.02 | 34.68 | 0.057 | 40.0 | 48.5 | - | - | - |
| Untyped OT-CFM | 66.94 | 40.15 | 0.202 | 64.6 | 47.1 | - | - | - |
| I-CFM (random) | 85.55 | 56.81 | 0.307 | 41.3 | 39.2 | - | - | - |
| LogitNorm OT-CFM | 92.96 | 62.43 | 0.070 | 48.7 | 48.0 | - | - | - |
| Ours | 11.11 | 2.14 | 0.570 | 60.2 | 23.2 | - | - | - |
Download
Core Resources
Dataset
Real nuclei crops + generated temporal sequences with per-cell-type protocol setup.
🤗 Hugging FaceCode
Training, inference, and evaluation scripts for our method.
GitHub RepoPretrained Models
Released checkpoints for reproducible benchmark comparison and downstream testing.
Model WeightsCitation
BibTeX
@article{zhang2026xensen,
  title   = {XenSen-Bench: A Multi-Tissue Benchmark for Cellular
             Senescence from Spatial Transcriptomics},
  author  = {Xiang Zhang and Boxuan Zhang and Ting Long and
             Haotian Zhuang and Jason Ji and Ruixiang Tang and
             Heng Fan and Dongfang Liu},
  journal = {NeurIPS Datasets and Benchmarks Track},
  year    = {2026}
}